|
|
||||||||||||||||||||||||||||||||||||||||||||||||||||||||||||||||||||||||||||||||||||
 |
|||||||||||||||||||||||||||||||||||||||||||||||||||||||||||||||||||||||||||||||||||||
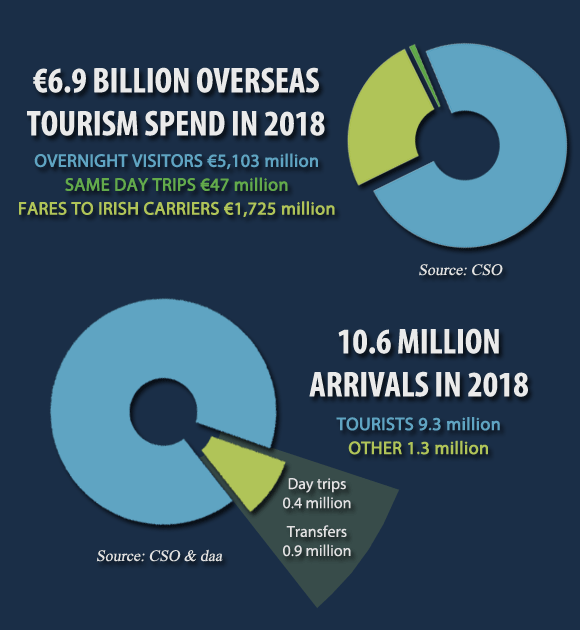
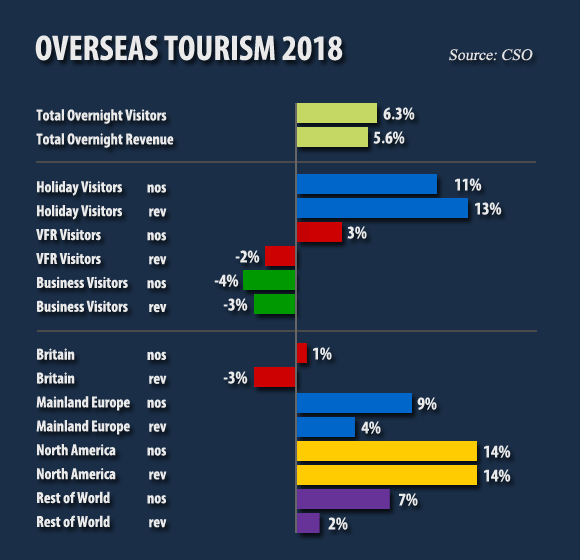
Revenue generated by visitors staying in the country topped €5 billion for the first time, an increase of 5.6% on the previous year. The number of arrivals into the country was up 6.9% year on year to a record 10.6 million. Visitors staying overnight reached a new high at 9.3 million, up 6.3% on the previous year. An 11% increase in holiday visits was particularly welcome. 1.3 million day visitors included an estimated 900,000 transfer trips through Dublin Airport.
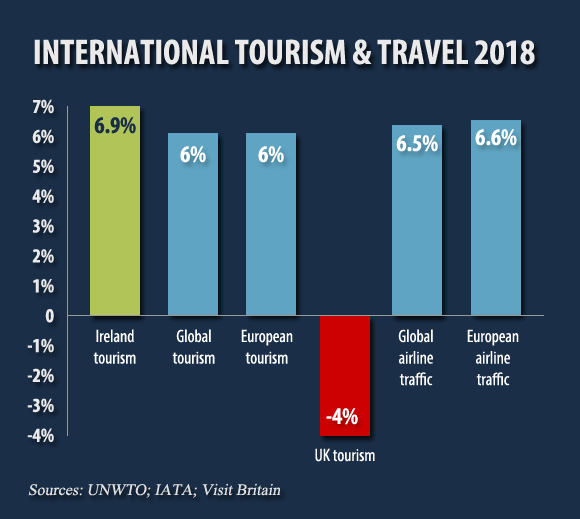
Ireland’s results in context Global travel continued to grow, with most destinations enjoying a record year in arrivals in 2018. International tourism to Ireland last year was broadly in line with global and European travel trends. Worldwide growth in tourist arrival figures was highest in the Middle East (up 10%), Africa (up 7%), with Asia/Pacific and Europe (both up 6%), while the Americas were below the world average (up 3%), according to UNWTO. Growth has been driven by stable fuel prices, improved air links between destinations and strong outbound travel demand from emerging markets. The drop in visitors to the UK, contrary to predictions, was in stark contrast to worldwide tourism growth. The decline is attributed to a falloff in demand from Europeans, who account for two thirds of overseas visits to Britain.
|
|
||||||||||||||||||||||||||||||||||||||||||||||||||||||||||||||||||||||||||||||||||||
 |
|||||||||||||||||||||||||||||||||||||||||||||||||||||||||||||||||||||||||||||||||||||
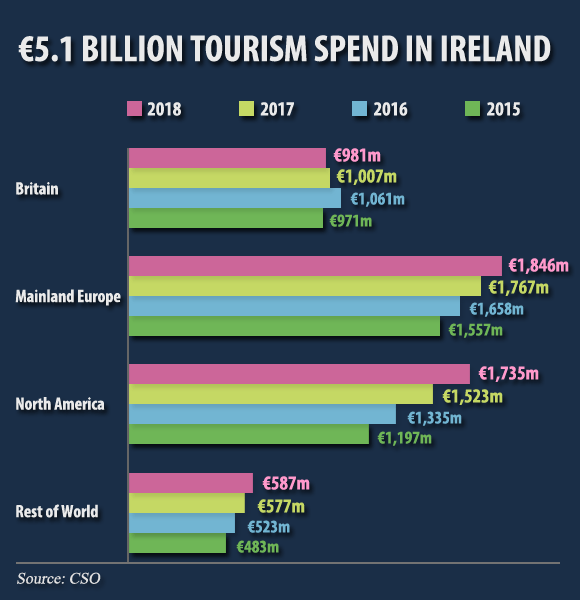
€6.9 billion in earnings from overseas tourists in 2018 Aggregate earnings from foreign tourists to the Irish economy in 2018 reached a record €6.874 billion, a 6% increase in current terms on 2017. €5.15 billion was spent in the country, including €47 million from day visitors, while Irish carriers earned an estimated €1.7 billion from visitors travelling to Ireland. €275 million increase in tourism receipts benefitted businesses throughout the country, a 5.6% increase to €5.15 billion. Continental Europe continues to be the most valuable source market netting €1.85 billion, up 4.5% on the previous year. Spending by North American tourists, growing faster than from other markets in recent years helped by a strong dollar, increased by 14% to reach €1.7 billion last year. Receipts from British tourists declined by 3% to below €1 billion. Earnings from visitors from the rest of the world grew by 2% to €587 million, surprisingly in contrast to recent years, the growth in value did not keep pace with the volume growth of 7%. €2.1 billion spent in the country by holiday visitors was up 13% on the previous year and accounted for an increased share of total earnings at 59%. Expenditure by VFR (visiting friends & relatives) and business visitors declined by 2% to €881 million and by 3% to €744 million respectively.
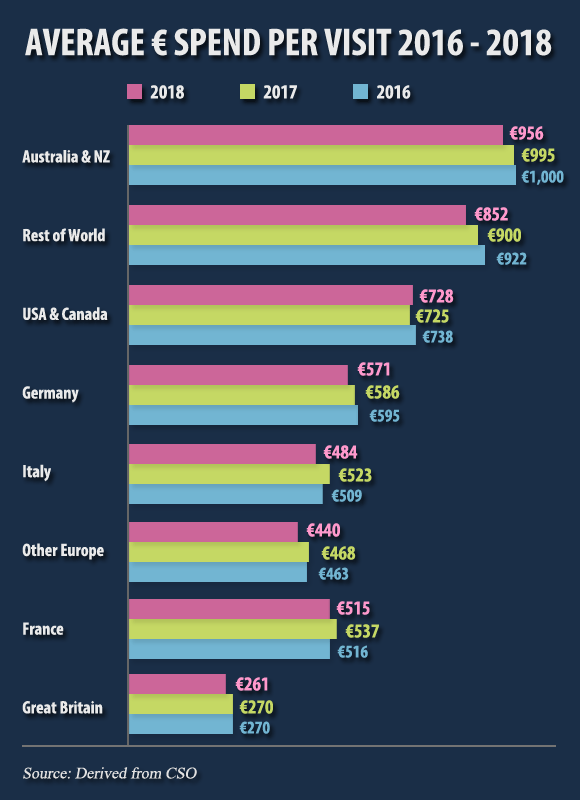
The return on marketing investment in long haul markets over recent years is apparent with receipts from these markets accounting for an increasing share of visits and revenue. In 2018 long haul markets were the sources of 27% share of visitors generating 45% of annual receipts. Ireland has become increasingly dependent on high spending tourists from North America and beyond for annual incremental revenue growth. Average expenditure per visit holds up The average spend per visit in 2018 is estimated at €550, almost no change from the previous year. The average spend varies considerably by source market and purpose of visit. Holiday/leisure visitors spent an average €593 per visit, which held up well on an increased volume. Business and VFR visitors spend on average €520 and €332 respectively, the former largely unchanged while the latter was down on the previous year. Length of stay and pattern of expenditure are the key determinants of average spend within each segment. Australians and New Zealanders topped the chart at €950 per visit, followed by visitors from new emerging long-haul markets spending on average €852. These long haul visitors tend to stay longer, up to an average of up to 14 nights, although the average length of stay slipped somewhat in 2018. Strong ethnic links with Australia and New Zealand, combined with the upscale profile and expenditure of visitors from the new developing long haul markets, particularly in Asia, account for the above average stay and expenditure. North American visitors are the next highest spenders, with an average expenditure per trip of €728, marginally up on the previous year, despite further slippage in the average length of stay from 6.9 to 6.6 nights. Germans continue to be top European spenders with an average trip expenditure in Ireland of €571, while the average spend by other Europeans ranges between €440 to €515. British tourists, with the shortest average stay in the country at 4.1 nights, spend the least per visit, an average of €261, marginally down on the previous year. The daily average expenditure ranges from €64 for British tourists to €110 for North Americans, with Germans spending an average of €74 per day and other Europeans at close to €60 daily. A note of caution may be appropriate as the data is based on sample surveys at point of departure, with the robustness of the data dependent on the accuracy of recall by visitors of their expenditure in the country.
|
|
||||||||||||||||||||||||||||||||||||||||||||||||||||||||||||||||||||||||||||||||||||
 |
|||||||||||||||||||||||||||||||||||||||||||||||||||||||||||||||||||||||||||||||||||||
Holiday visits driving growth in overseas tourists to Ireland
|
|
||||||||||||||||||||||||||||||||||||||||||||||||||||||||||||||||||||||||||||||||||||
 |
|||||||||||||||||||||||||||||||||||||||||||||||||||||||||||||||||||||||||||||||||||||
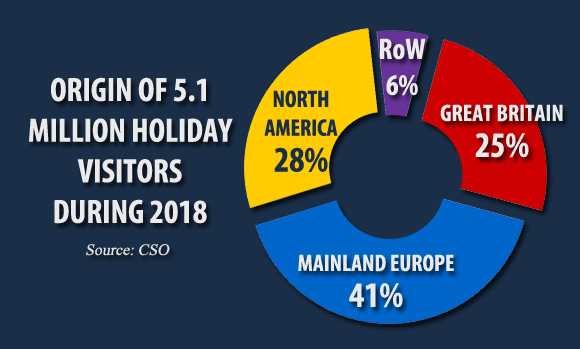
Where do holiday visitors come from? Continental Europe continued to be the largest source market for holiday trips to Ireland with almost 2.1 million trips accounting for 41% of the total by volume. For the first time Ireland welcome more holiday visitors from North America than from Great Britain, at just over 1.35 million and 1.27 million respectively. 6% of holiday visits, at close to 300,000 trips, came from countries beyond Europe and North America.
Germany is the top mainland European source market, accounting for 10% of all holiday visits, followed by France the source of 7% of the demand. The absolute and relative importance of the source markets for holidays in Ireland has changed significantly over the past 10 years. Britain historically the top source market for holiday visitors has been overtaken by Continental Europe and North America in value and volume.
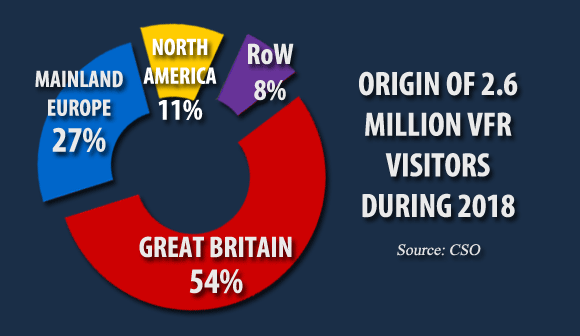
VFR demand Almost 2.6 million visitors came to visit friends or relatives, with more than half coming from Britain – an estimated 1.4 million in 2018. Mainland Europe has been increasing as a source of VFR demand over the past decade, reflecting migration patterns, and is now the source of 27% of VFR visits, in the region of 690,000 visits last year. Close to 500,000 visits to friends and relative came from long haul source markets last year, of which an estimated 300,000 were visiting from North America.
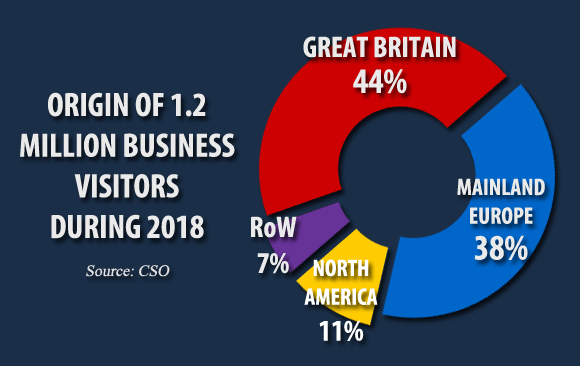
Business visitors Business tourist numbers were down 4% to an estimated to just over 1.2 million last year - the second successive year of decline. This demand segment includes visits for regular business meetings, trade events, together with conferences and incentive travel groups. Demand from the primary sources - Britain and mainland Europe - would appear to have been soft.
|
|
||||||||||||||||||||||||||||||||||||||||||||||||||||||||||||||||||||||||||||||||||||
 |
|||||||||||||||||||||||||||||||||||||||||||||||||||||||||||||||||||||||||||||||||||||
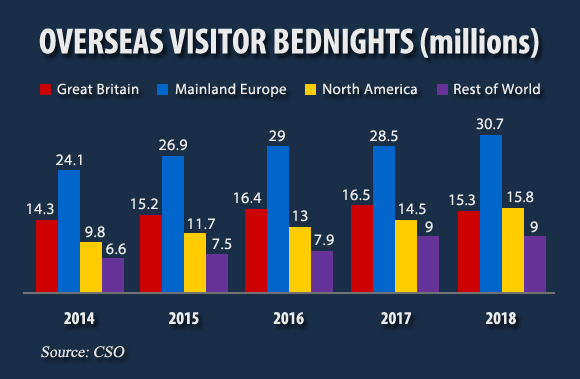
Nights spent in Ireland in 2018 increased by 3%, 2.2 million additional nights, compared to the previous year. The net increase in nights was due to increased demand from mainland European and North American tourists, while bednight demand from British tourist declined and demand from new emerging markets remained stable. Mainland European tourists accounted for almost 31 million bednights, up 7% on the previous year and accounting for 43% of total demand. North American visitor nights increased by 9% to 15.8 million, overtaking the 15.3 million nights in the country by British tourists. Other long-haul markets spent 9m nights here.
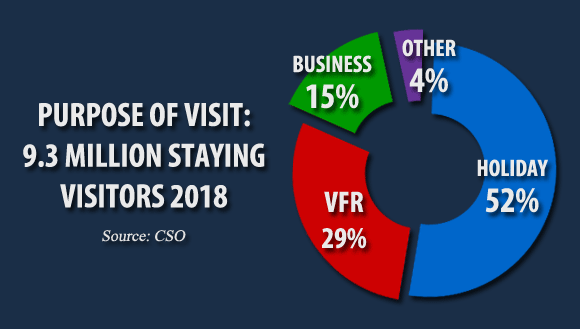
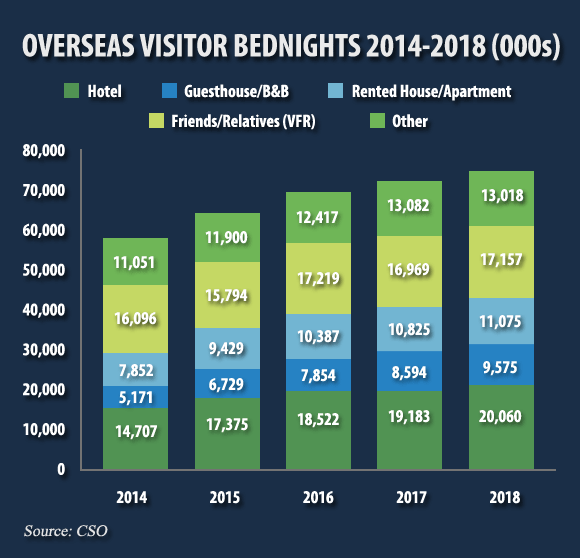
Bednights from holiday visitors increased by 9% year on year, with VFR nights up 2% and demand from business visitors down 3%. Holiday visitors accounted for an increased share of bed nights at 46%. VFR visits accounted for 26%, with business and those visiting for ‘other reasons’ at 12% and 15% respectively. Where did they stay? Paid serviced accommodations (Hotels, Guesthouses, and B&Bs) catered to 42% of the demand, while 24% of bednights were spent with friends and relatives. Rented accommodation commanded a 16% share of bednights, with a further 18% spent in ‘other forms of accommodation’. The latter may reflect increased use of Airbnb. The serviced accommodation sector’s share was up 2 points, while the share of stays with friends and relatives and stays in other accommodations each declined by 1 point. Overseas tourist demand for hotels increased by 4.6% to over 20 million bed nights, while demand for Guesthouse/B&Bs was up 11% to 9.6 million. Stays with friends and relatives and in rented accommodations were up marginally, with ‘other accommodations’ categories experiencing a marginal decline.
Hotels sold almost 900,000 more bednights to overseas visitors in 2018, driven by 1.2 million growth from holiday visitors which more than compensated for a drop in demand from those visiting for business and other reasons. North America was the most buoyant source market for the hotel sector (+12%) followed by mainland Europe (+2%), with each source market accounting for close to 7.2 million bednights. Demand from Britain was down by almost 2% to just under 4 million bednights. Guesthouses and B&Bs enjoyed double digit growth in demand from holiday tourists, who account for almost 75% of the sector’s overseas volume business. The category enjoyed double digit growth in demand from mainland Europe and North America to 4.6 million and 3 million bednights respectively, while demand from Britain fell by 7% to 1 million. Rented accommodation experienced a 2% increase in the number of bednights from overseas visitors, driven by holiday demand which offset declines from business and ‘other’ segments. Mainland Europe, the top source market for the category, produced 16% growth in bednights with slower growth from North America, in contrast to a fall in demand from Britain and new emerging markets. |
|
||||||||||||||||||||||||||||||||||||||||||||||||||||||||||||||||||||||||||||||||||||
Note on data source The latest CSO data for 2018 - Tourism and Travel Quarter 4 2018 (released March 13, 2019) - provides the basis for a detailed analysis of the demand from overseas which goes beyond monthly visitor head count. The latest quarterly data provides insights into the reason for visit, expenditure patterns and key metrics of length of stay and use of accommodation. The CSO data is based on arrivals into air and sea ports in the Republic, but does not include overseas arrivals via ports in Northern Ireland. The latter will be included Failte Ireland’s Tourism Facts 2018 when available. www.cso.ie/en/releasesandpublications/er/tt/tourismandtravelquarter42018 |
|||||||||||||||||||||||||||||||||||||||||||||||||||||||||||||||||||||||||||||||||||||
|
|||||||||||||||||||||||||||||||||||||||||||||||||||||||||||||||||||||||||||||||||||||

